Workflows
Inspect MongoDB profiler history
Read bounded slow-query evidence from an existing system.profile collection without enabling or reconfiguring the profiler.
Profiler history reads MongoDB's existing system.profile collection. mongoui never
enables, disables, resizes, or reconfigures the database profiler.
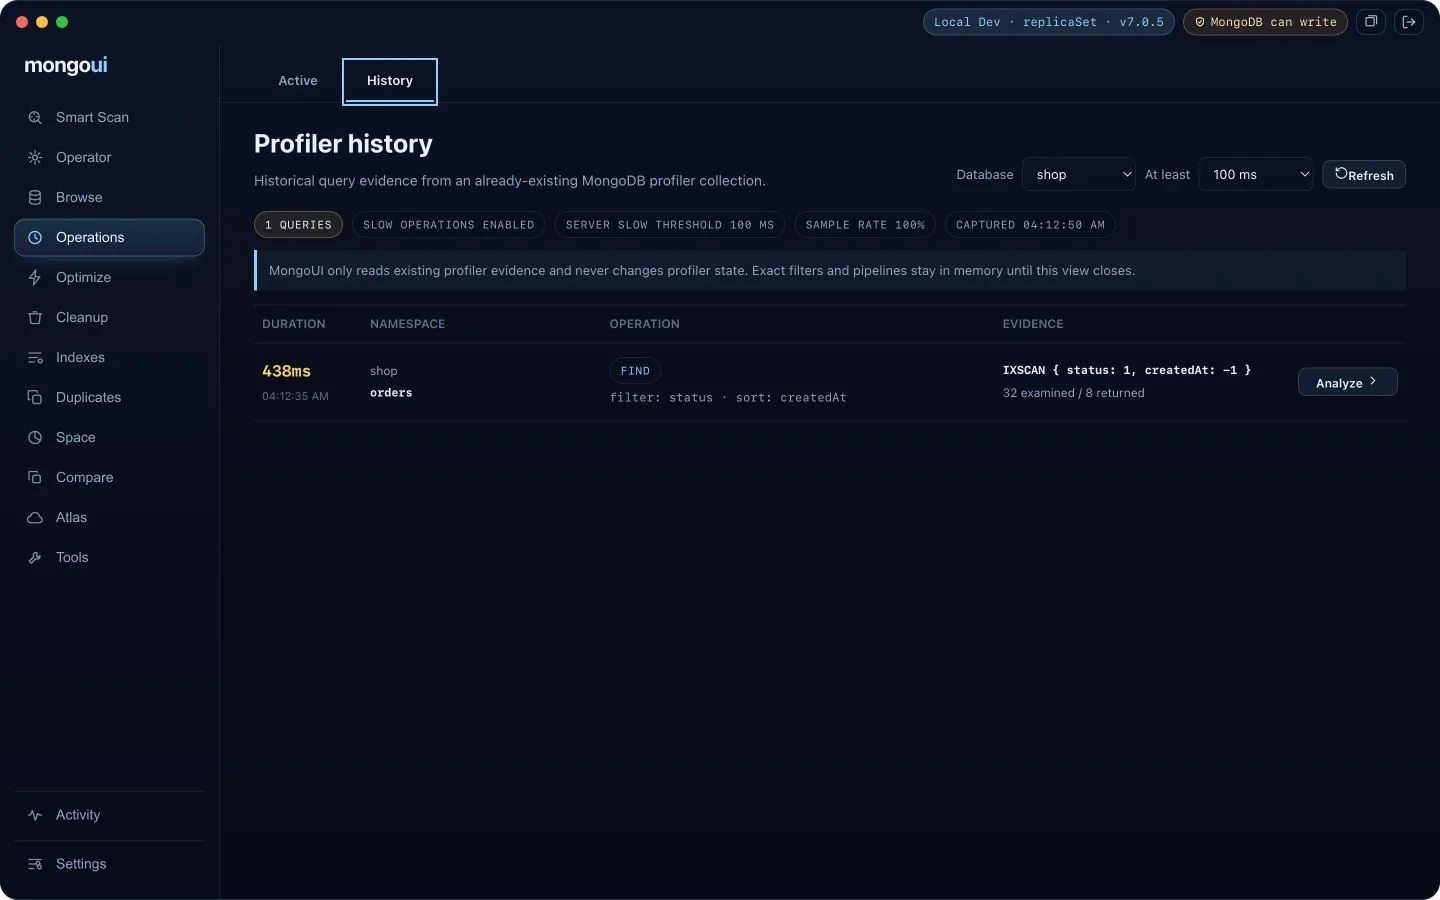
Read historical operations
- Open Tools, then Operations workbench.
- Choose Profiler history.
- Select a database.
- Choose a minimum duration: 0, 50, 100, 500, or 1,000 ms.
- Refresh the snapshot.
Each read has a five-second server budget and returns at most 50 recent operations. The summary reports the observed profiler level, server slow threshold, sample rate, capture time, and whether more rows existed.
Rows can include duration, namespace, operation type, plan summary, keys examined, documents examined, documents returned, and application name when MongoDB recorded them. Missing metrics remain missing; mongoui does not infer values that the profiler did not capture.
Analyze a captured query
Supported find and aggregation entries expose Analyze. This opens the exact
in-memory review payload in the existing Browse or Optimize workflow. From there, run
a fresh bounded explain() against the current database state before creating an
index or changing a query.
The historical operation can be old. Treat its filter and pipeline as evidence of what ran, not proof that the same plan or data distribution still exists.
Know the privacy and operational boundary
system.profile can contain literal filters and pipeline values. Exact review payloads
remain in memory only until the view closes. List metadata and local history do not
retain raw literals.
MongoDB warns that profiling can affect performance, disk use, and query privacy. mongoui deliberately refuses to manage profiler state. If the profiler is off, empty, sampled, set to a higher threshold, unavailable through the topology, or denied by authorization, the screen reports that state instead of changing the server.
Canceling a refresh closes the active read and leaves the previous snapshot visible.
For current in-flight work, use the Active operations tab in the same workbench. For the plan itself, see find and explain slow MongoDB queries.