
To find slow queries in MongoDB, rank real server evidence before touching an index. The quick source is the slow-operation log. The detailed source is the per-database system.profile collection when profiling is enabled. Read millis, planSummary, keysExamined, docsExamined, and nreturned, then run a fresh explain("executionStats") on the worst useful query. Guessing from application code is possible too, in the same way finding a leak by staring at the plumbing diagram is possible.
The slow-operation log is the cheapest first pass
MongoDB logs operations that cross its slow-operation threshold. The log can tell you the namespace, duration, plan summary, and scan counts without creating a queryable profiler collection.
A useful entry looks like this in substance:
command: find orders
planSummary: COLLSCAN
keysExamined: 0
docsExamined: 486213
nreturned: 18
durationMillis: 812
That query read 486,213 documents to return 18. The COLLSCAN confirms that no index narrowed the work. You have a candidate, not yet a fix.
The log is ideal when you already collect and search server logs. It becomes awkward when you need to group recurring query shapes, sort by scan ratio, or reopen the original operation. That is where profiler history earns its keep.
system.profile turns slow operations into queryable evidence
MongoDB's database profiler writes captured operations to a capped collection named system.profile. It is configured per database. Profiler level 1 captures operations above a threshold or matching a filter; level 2 captures all operations.
MongoDB's own database profiler guidance warns that profiling can affect performance, disk use, and query privacy. Start with the least invasive source available. If you enable profiling, use a deliberate threshold, sample, or filter and a defined time window.
For example, this enables level 1 with a 100 ms threshold in the current database:
db.setProfilingLevel(1, { slowms: 100 })
Then rank recent slow entries:
db.system.profile.find(
  { millis: { $gte: 100 } },
  {
    ts: 1,
    ns: 1,
    op: 1,
    command: 1,
    millis: 1,
    planSummary: 1,
    keysExamined: 1,
    docsExamined: 1,
    nreturned: 1
  }
).sort({ ts: -1 }).limit(50)
The exact fields vary by operation and MongoDB version. The profiler output reference documents the current shape. Missing fields are not zero. They are missing, which is less convenient but considerably more honest.
Four fields tell most of the first story
Start with millis. It tells you the server-side duration and gives you a ranking. Do not optimize purely by duration, though. A rare maintenance query and a 40 ms query called 10,000 times per minute have different economics.
Then read the plan and scan counts:
planSummary: COLLSCANmeans MongoDB scanned the collection.keysExamined: 0confirms that the operation used no index keys.docsExaminedfar abovenreturnedmeans the query did much more document work than its output required.keysExaminedfar abovenreturnedcan mean an index is present but poorly aligned with the filter or sort.
Group repeated work by the server-reported query shape when available. One expensive query shape called all day usually matters more than a one-off administrative command at the top of a duration sort.
explain() proves the current plan
Profiler evidence is historical. Indexes, collection cardinality, cached plans, and data distribution may have changed since the operation ran. Reconstruct the supported find or aggregation and run a fresh explain before changing anything:
db.orders.explain("executionStats").find(
  { status: "shipped", customerId: ObjectId("64f000000000000000000001") }
).sort({ createdAt: -1 })
MongoDB's slow-query explain guide recommends checking execution time, scan stages, keys examined, documents examined, and returned rows. The useful index follows the actual filter and sort. A random single-field index added because a field looked important is how index inventories become geological records.
Compare the result before and after any candidate index. The goal is not merely to replace COLLSCAN with IXSCAN. The goal is to reduce examined work while preserving the query's output and sort semantics.
mongoui reads history without changing profiler state
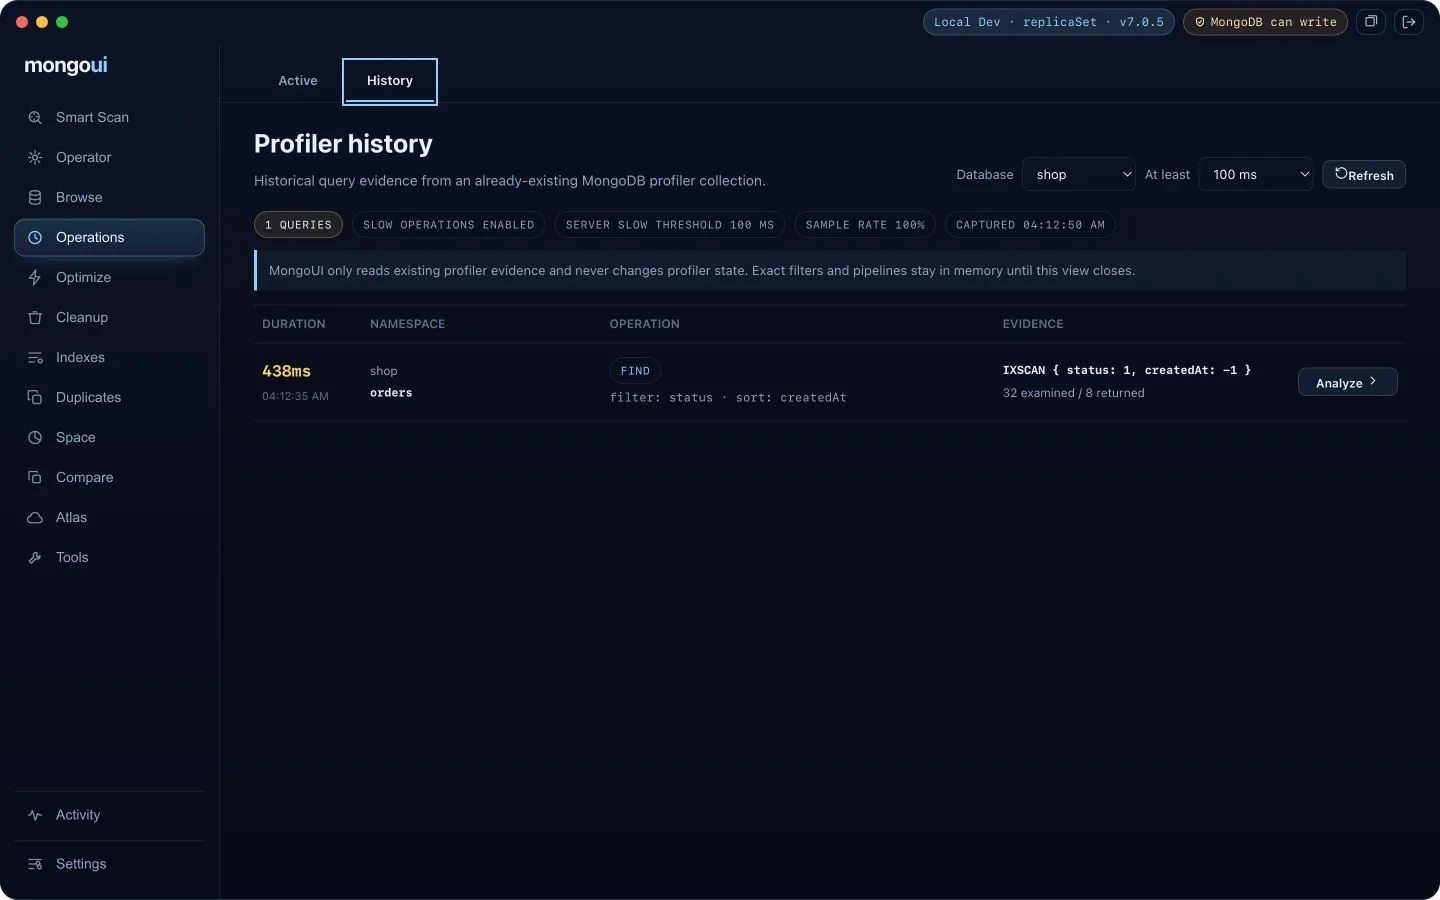
Open Tools, Operations workbench, then Profiler history. Choose a database and a minimum duration. mongoui reads at most 50 recent operations under a five-second server budget and reports the profiler level, server threshold, sample rate, capture time, and truncation state that MongoDB exposed.
It does not enable, disable, resize, or reconfigure the profiler. If the profiler is off, unavailable, denied, empty, sampled, or set above your selected threshold, the screen says so. Existing exact filters and pipelines remain in memory while the view is open and are not copied into local list history.
Profiler history and local explanations make no AI call. If you explicitly choose provider-backed analysis later, the disclosed query and bounded structural evidence go directly to the selected provider; mongoui has no AI proxy.
Supported find and aggregation rows expose Analyze. That action opens the historical operation in Browse or Optimize for a fresh bounded plan analysis. The Profiler history guide covers the product boundary and cancellation behavior.
Use live operations for the query running now
Profiler history answers "what was slow." Active operations answers "what is still running." The Operations workbench can take a bounded snapshot of current work and open supported operations for analysis without changing profiler configuration.
Use both views as a funnel:
- Find a recurring or currently expensive operation.
- Reopen its exact query shape.
- Run a fresh explain.
- Review an index or query change.
- Measure the same evidence again.
The broader MongoDB performance optimization guide covers index, aggregation, and storage work around that loop. When the query is known, fix a slow MongoDB query walks through the plan itself. The profiler finds the suspect. explain() still gets to question it.